|
Magnetic
Resonance -
Technology
Information
Portal |
Welcome to MRI Technology • • |
|
|
 | Info
Sheets |
| | | | | | | | | | | | | | | | | | | | | | | | |
 | Out-
side |
| | | | |
|
| | | | | | | | |  | Chemical Shift Artifact | | |
Quick Overview Please note that there are different common names for this artifact.
DESCRIPTION
Black or bright band
During frequency encoding, fat protons precess slower than water protons in the same slice because of their magnetic shielding. Through the difference in resonance frequency between water and fat, protons at the same location are misregistrated (dislocated) by the Fourier transformation, when converting MRI signals from frequency to spatial domain. This chemical shift misregistration cause accentuation of any fat-water interfaces along the frequency axis and may be mistaken for pathology. Where fat and water are in the same location, this artifact can be seen as a bright or dark band at the edge of the anatomy.
Protons in fat and water molecules are separated by a chemical shift of about 3.5 ppm. The actual shift in Hertz (Hz) depends on the magnetic field strength of the magnet being used. Higher field strength increases the misregistration, while in contrast a higher gradient strength has a positive effect. For a 0.3 T system operating at 12.8 MHz the shift will be 44.8 Hz compared with a 223.6 Hz shift for a 1.5 T system operating at 63.9 MHz.

Image Guidance
| | |
• View the DATABASE results for 'Chemical Shift Artifact' (7).
| | | | |  Further Reading: Further Reading: | | Basics:
|
|
News & More:
| |
| |
| | |
| | |  Case Study 1 : Case Study 1 :
| 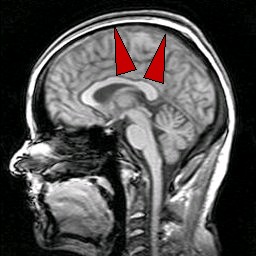 | | In this case study the chemical shift artifact is visible as a small dark or bright border at the interfaces of bone, fat and muscle, best seen in the upper part of the head. This scan is taken with maximum water fat shift. |
| | |
| | | Case Study 2 :
| 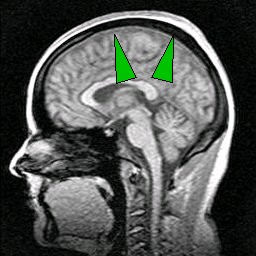 | | This image is the same slice as case 1, but scanned with minimum water fat shift. The interface borders are smaller, but the minimized water fat shift produces more noise and a less signal to noise ratio. |
| | |
| | | Case Study 3 :
| 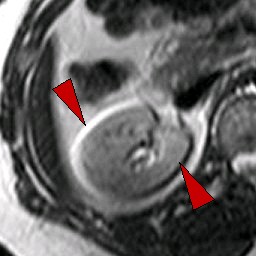 | | In this gradient echo image the typical artifact appears as a black and bright border in the frequency direction right and left of the kidney. |
| | |
| | | Case Study 4 :
| 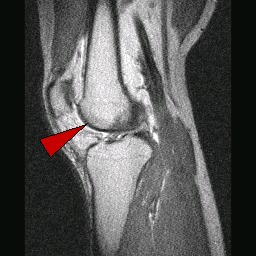 | | In this image the chemical shift artifact is seen as a small bright line in front of the femoral bone. |
| | |
| | | | | | |
|
|
| |
 | Look
Ups |
| |
|
MR-TIP.com uses cookies! By browsing MR-TIP.com, you agree to our use of cookies. | | | [last update: 2024-02-26 03:41:00] |
|
|